Debugging quantization degradation in AMD Quark#
Note
In this documentation, AMD Quark is sometimes referred to simply as “Quark” for ease of reference. When you encounter the term “Quark” without the “AMD” prefix, it specifically refers to the AMD Quark quantizer unless otherwise stated. Please do not confuse it with other products or technologies that share the name “Quark.”
Quantization is a destructive compression method that may degrade the predictive performance of quantized models. As we strive to strike a balance between model compression and preserving predictive capabilities of quantized models, it is useful to gain insight into which layers are most sensitive to quantization, and thus likely which quantized layers degrade prediction quality the most.
AMD Quark provides a tool to analyze the quantization error of each of the quantized layers in a given model. This tool currently only supports quantization in eager mode, that is to say PyTorch default mode without using graph-based (torch.compile, torch.fx.GraphModule) quantization.
When using AMD Quark quantizer in eager mode, typically
from quark.torch import ModelQuantizer

# Define quant_config, model, optionally define dataloader for static quantization.

quantizer = ModelQuantizer(quant_config)
quant_model = quantizer.quantize_model(model, dataloader)
one can enable debugging features using the following environment variables:
QUARK_DEBUG: Path to a folder that will store statistics and distribution plots of the quantized weights/activations.QUARK_DEBUG_ACT_HIST: Whether to plot histograms for activations distributions. This is disabled by default,QUARK_DEBUG_ACT_HIST=1should be used to enable the feature.QUARK_DEBUG_INPUT_PICKLE: Path to a pickled model input (typically a.ptfile saved usingtorch.save) that should be used to collect activations statistics (and optionally, distributions histograms). If this argument is not specified, thedataloaderfirst batch will be used instead.QUARK_DEBUG_NAN: Whether to raise an exception if a NaN is detected during the quantization process. This is disabled by default.
Relevant metrics and plots are saved in the folder specified by the QUARK_DEBUG environment variable, for example:
├── model.layers.0.mlp.down_proj.input_histogram.png
├── model.layers.0.mlp.down_proj.input_qdq_histogram.png
├── model.layers.0.mlp.down_proj.input_ref_histogram.png
├── model.layers.0.mlp.down_proj.input_ref_histogram_absmean_ch0.png
├── model.layers.0.mlp.down_proj.input_ref_histogram_absmean_ch1.png
├── model.layers.0.mlp.down_proj.weight.png
├── model.layers.0.mlp.down_proj.weight_stats.json
├── model.layers.0.mlp.gate_proj.input_histogram.png
├── model.layers.0.mlp.gate_proj.input_qdq_histogram.png
├── model.layers.0.mlp.gate_proj.input_ref_histogram.png
├── model.layers.0.mlp.gate_proj.input_ref_histogram_absmean_ch0.png
├── model.layers.0.mlp.gate_proj.input_ref_histogram_absmean_ch1.png
├── model.layers.0.mlp.gate_proj.weight.png
├── model.layers.0.mlp.gate_proj.weight_stats.json
├── ...
...
├── summary_io_quantization_error.png
├── summary_ref_input_error.png
├── summary_ref_output_error.png
└── summary_weight_error.png
The file names correspond to the following:
*input_histogram.png: Histogram of the activation inputs to aFakeQuantizelayer.*input_qdq_histogram.png`: Histogram of the activation outputs of the ``FakeQuantizelayer (after QDQ).*input_ref_histogram.png: Histogram of the reference inputs at the point theFakeQuantizelayer is inserted (input or output of a module). Note that this histogram is based on the non-quantized model.*input_ref_histogram_absmean_ch0.png: Histogram of the reference inputs at the point theFakeQuantizelayer is inserted, mean of absolute values reduced on the -2 dimension. Note that this histogram is based on the non-quantized model.*input_ref_histogram_absmean_ch1.png: Histogram of the reference inputs at the point theFakeQuantizelayer is inserted, mean of absolute values reduced on the -1 dimension. Note that this histogram is based on the non-quantized model.*weight.png: Histogram of the non-quantized weight values.*summary_io_quantization_error.png: Bar plot over all layers of the relative error of the output tensor ofFakeQuantizecompared to its input tensor, i.e.
*summary_ref_input_error.png: Bar plot over all layers of the relative error of the input tensor ofFakeQuantizecompared to the reference input tensor (non-quantized model), i.e.
*summary_ref_output_error.png: Bar plot over all layers of the relative error of the output tensor ofFakeQuantizecompared to the reference input tensor (non-quantized model, QDQ is identity), i.e.
*summary_weight_error.png: Summary of weight quantization error over each layers, bar plot over all layers.
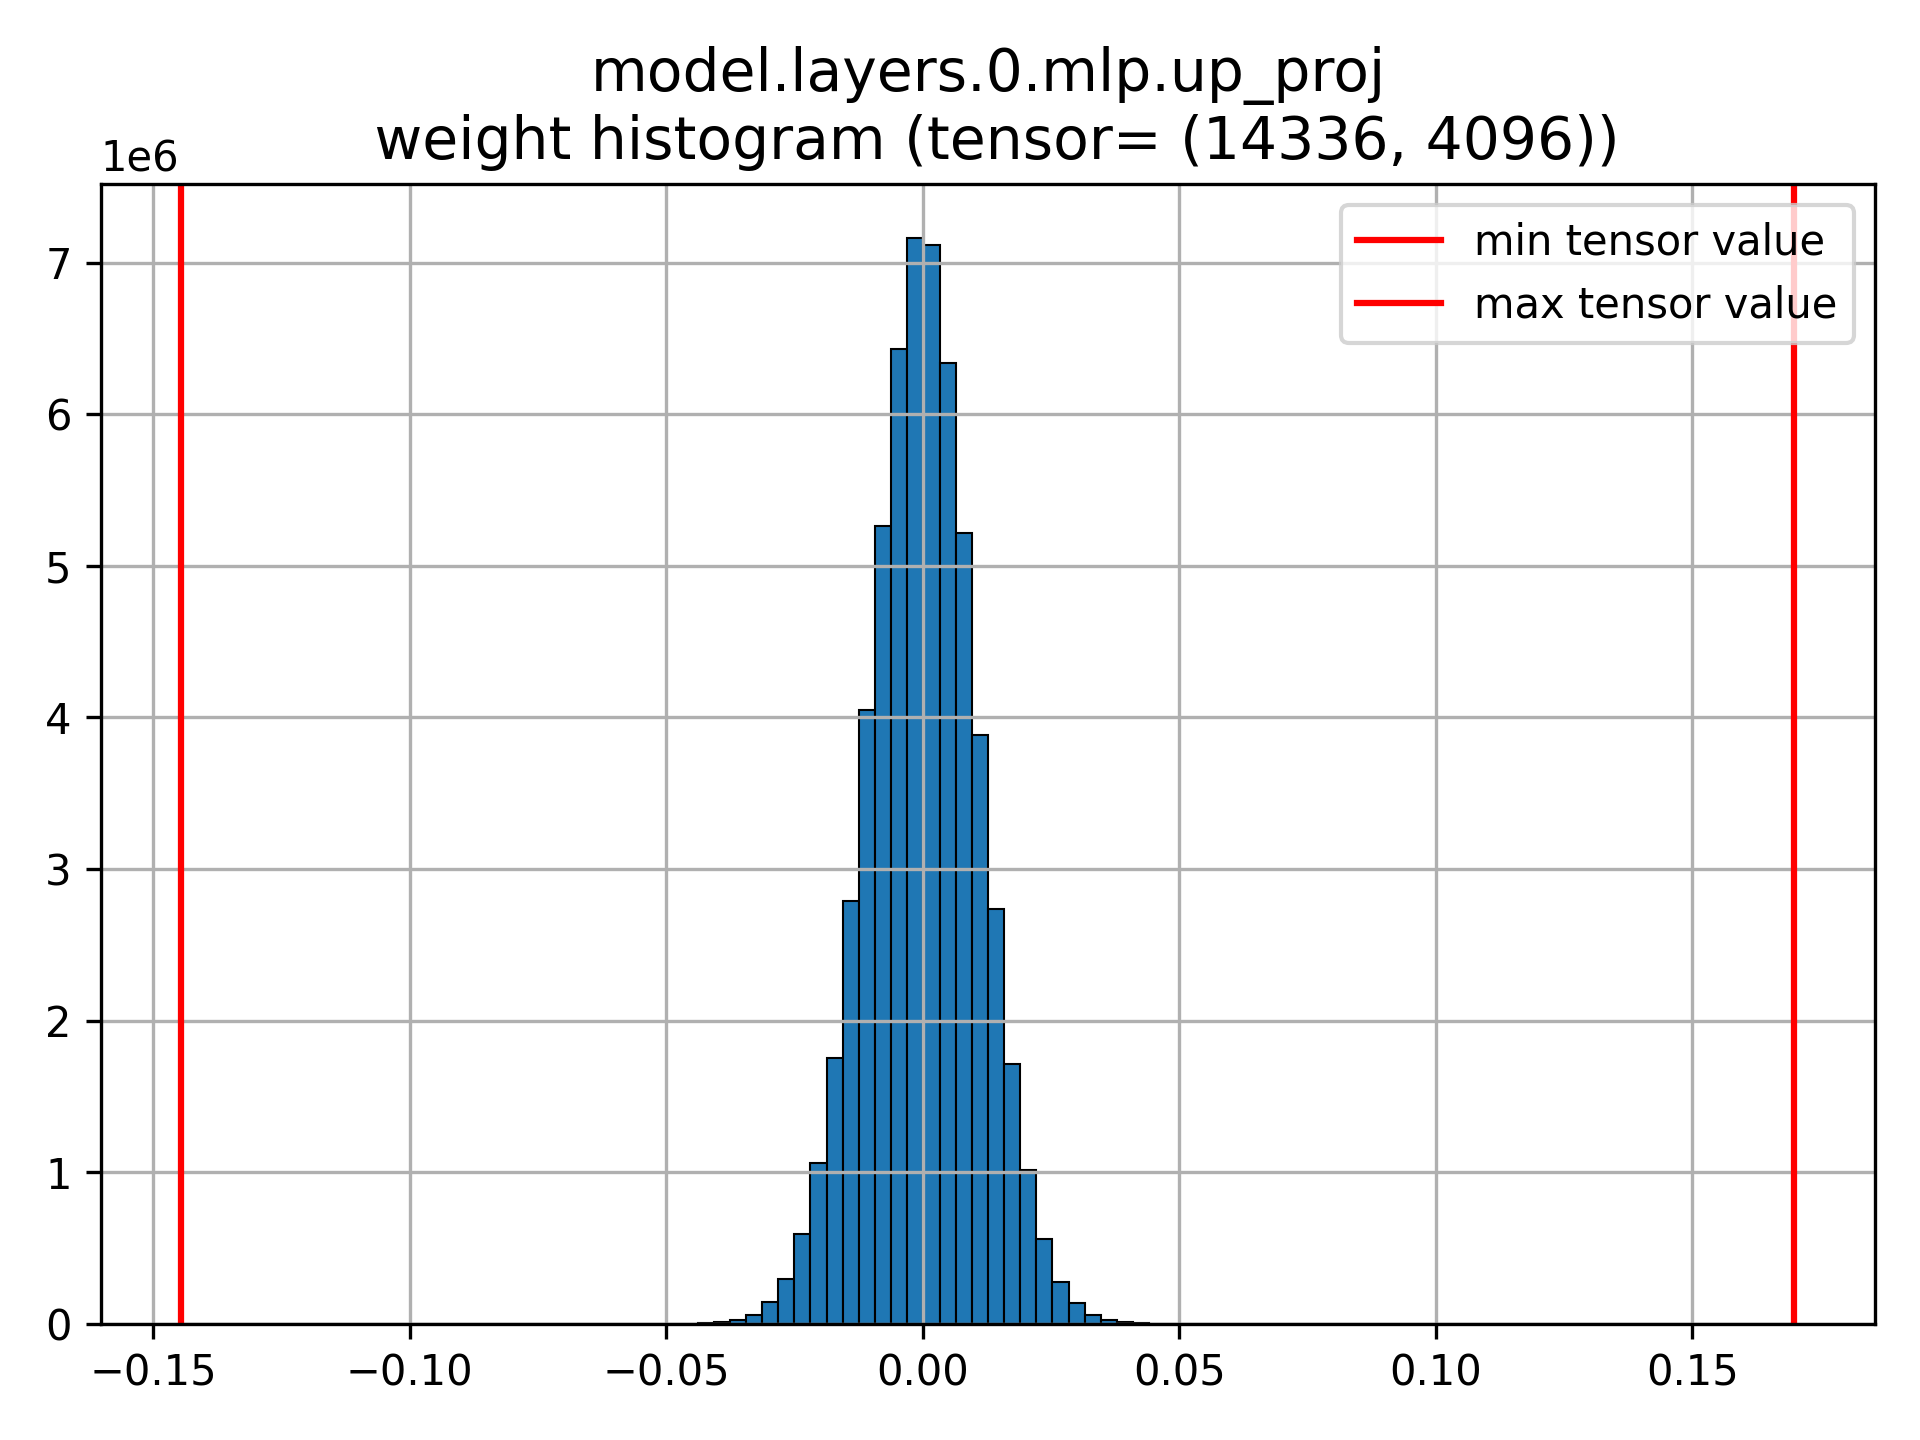
Here are some examples of these statistics/plots on a naive A8W8 integer static per-tensor quantization of meta-llama/Meta-Llama-3-8B-Instruct:

Example of a weight tensor distribution.#

Summary over all quantized layers of the relative error of the quantized module input compared to the non-quantized module input (from the reference non-quantized model).#
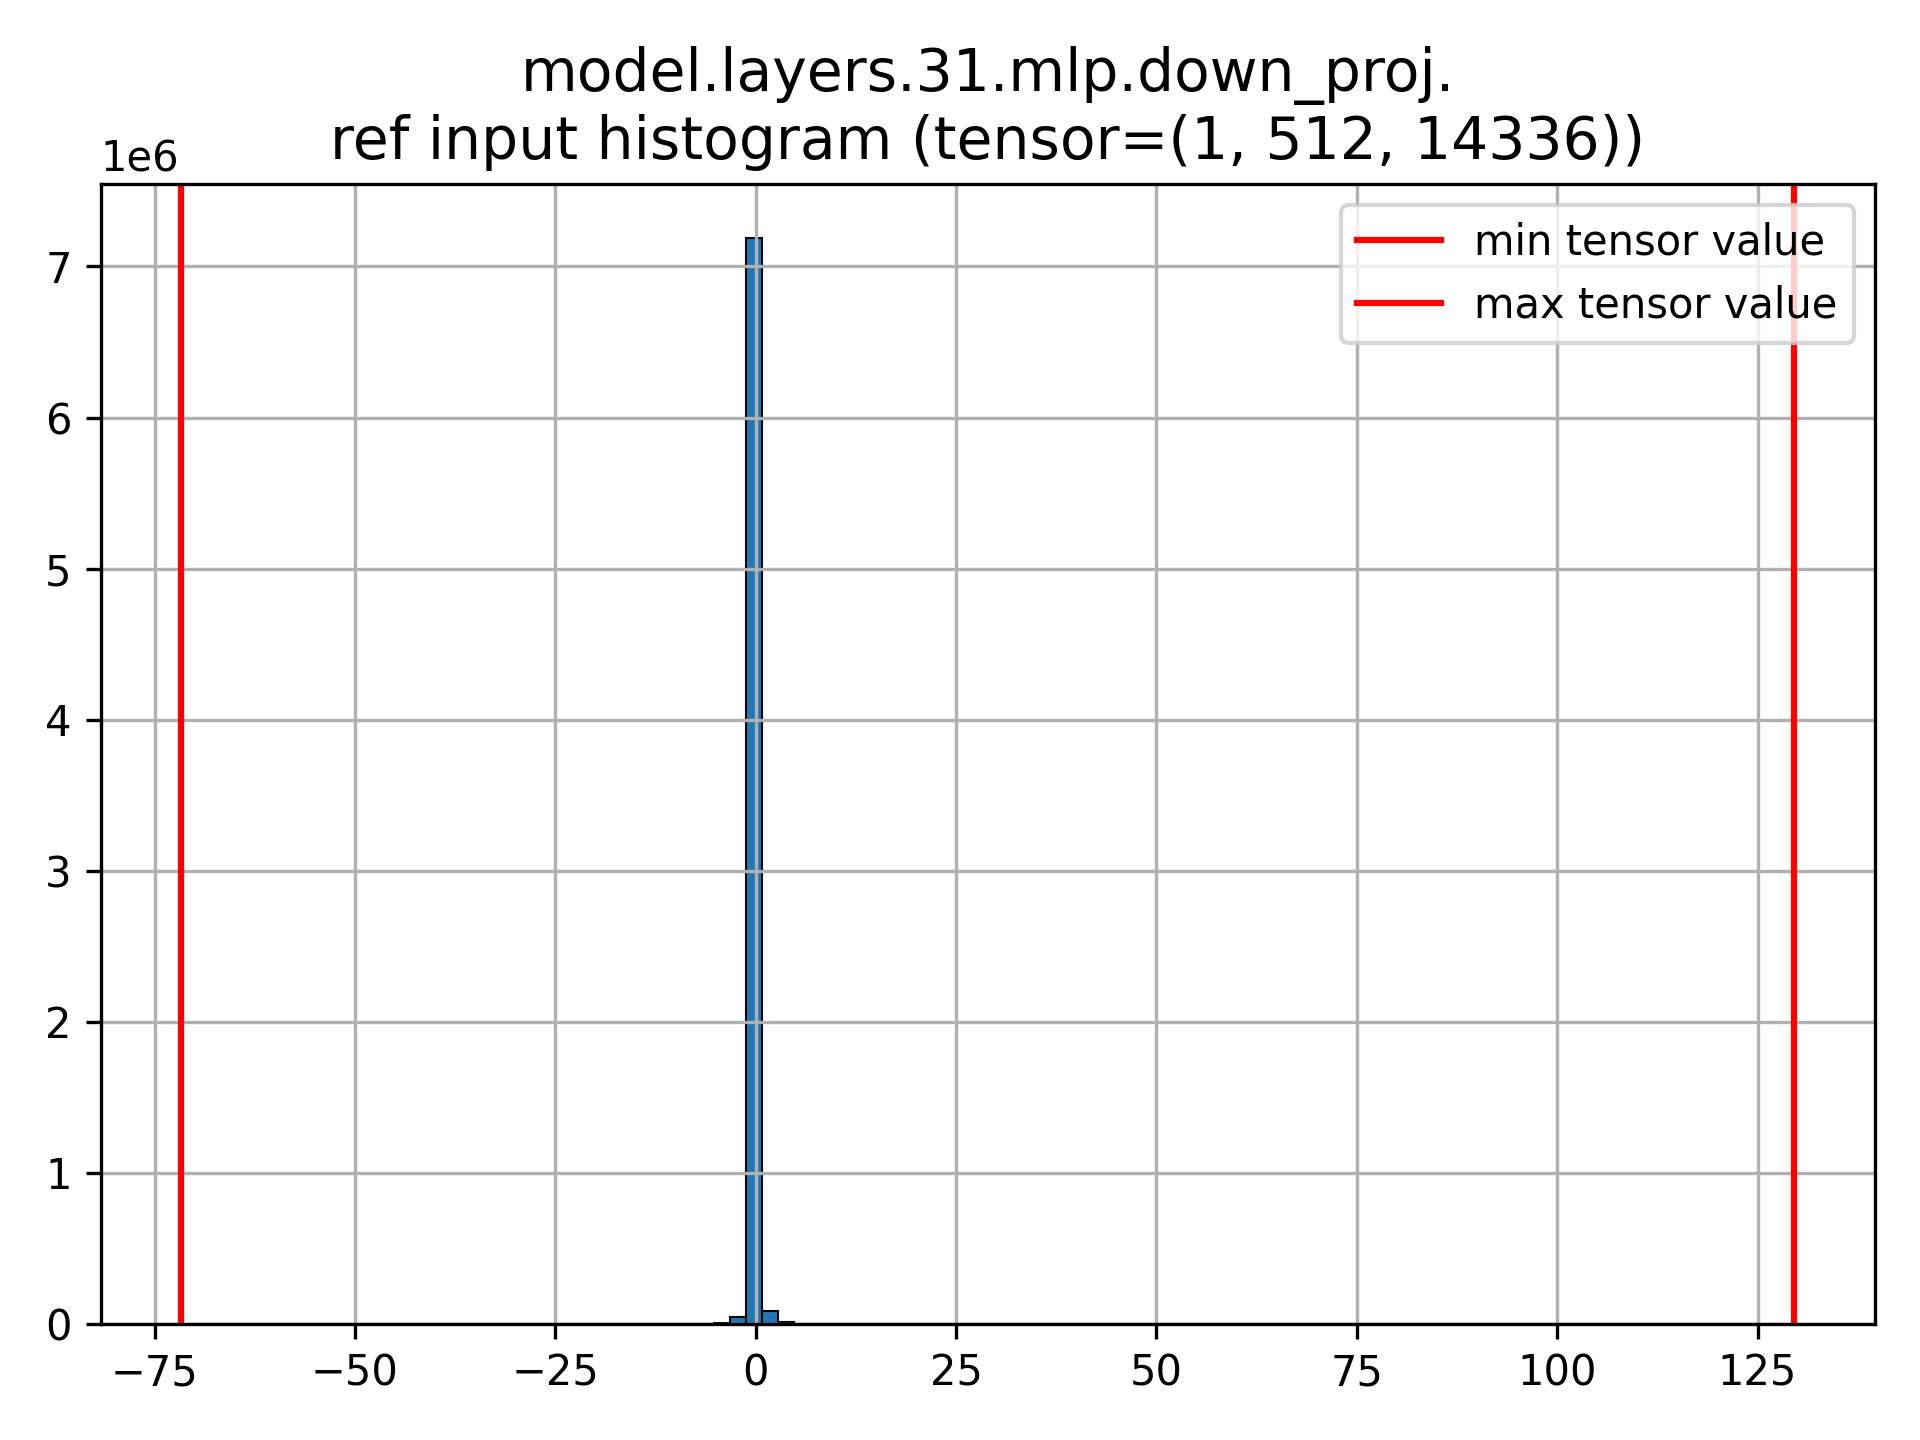
We see that the layer 31 (last layer) is very sensitive to quantization. In fact, the distribution of activations before down_proj layer is very wide, making its quantization difficult with a simple min-max scheme:

model.layers.31.mlp.down_proj reference (non-quantized) input distribution. We see a very large range of values.#
These indications may motivate us to quantize down_proj from the layer 31 (or perhaps all layers, or some other layers) in a different fashion, or to exclude it from being quantized.