Latency and Memory profiling for Quark ONNX#
Introduction#
AMD Quark ONNX now provides comprehensive latency and memory usage profiling to help users understand and optimize the performance of their quantization workflows. These profiling tools are designed to give fine-grained visibility into the time and memory consumed across different stages of the quantization process, enabling more efficient debugging, optimization, and deployment—especially in compute- or memory-constrained environments.
Latency Profiling
Quark ONNX quantization typically involves two major stages:
Calibration: Required for collecting activation statistics and generating quantization parameters.
Finetuning (optional): A layer wise optimization step that adjusts model weights after calibration to reduce accuracy loss.
Each of these stages contains multiple sub-steps (such as data loading, activation collection, parameter computation, and model rewriting), and Quark ONNX now reports the detailed latency of each one. In addition to these major stages, the tool also measures the time spent in supporting operations such as preprocessing and static quantization, which usually consume less time but can still be relevant in certain workflows.
The end-to-end quantization time is also recorded. With these results, users can clearly identify latency bottlenecks and decide where to focus optimization efforts. For example, if the profiling shows that the workflow is compute-bound, users may consider accelerating the pipeline using ROCM GPUs.
Memory Usage Profiling
Another important aspect is memory usage profiling. Quark ONNX offers a simple but effective mechanism for tracking CPU memory usage throughout the quantization pipeline. In workflows where ONNX Runtime uses the ROCMExecutionProvider or torch training on ROCM GPU, some quantization steps may also involve GPU execution. For these scenarios, Quark ONNX provides a tutorial demonstrating how to profile ROCm GPU memory usage as well.
By examining memory usage across different quantization stages, users can determine peak memory requirements and make informed decisions when quantizing models on devices with limited memory capacity. This is particularly valuable for shared-resource environments, and GPU-constrained systems.
Latency profiling#
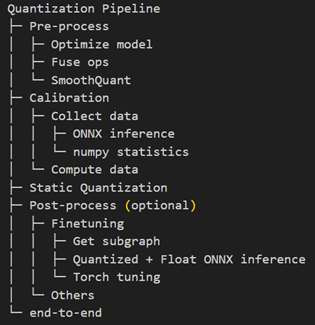
The Quark ONNX quantization workflow is organized into several well-defined stages. Each stage performs specific operations that contribute to the overall quantization pipeline, and their individual latency are reported in the profiling results.
Quantization pipeline
Viewing Latency Profiling Results
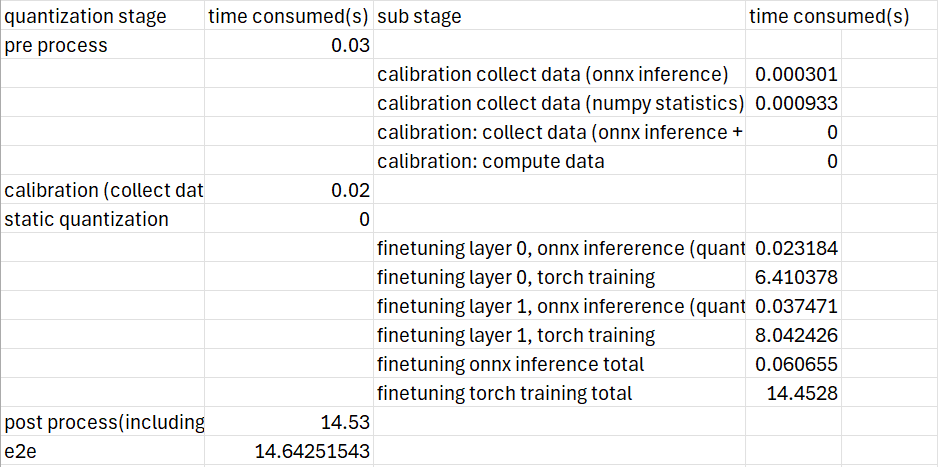
After quantization completes, Quark ONNX generates a file named quantized_info.csv, which contains the detailed latency profiling results for each stage and sub-stage. This report makes it easy to identify which parts of the pipeline consume the most time.
Memory profiling#
Efficient memory usage is critical when performing model quantization, especially in environments with limited CPU or GPU resources. Quark ONNX provides simple and effective methods to profile both CPU memory and ROCM GPU memory during quantization. This section introduces the tools required and explains how to collect and interpret memory profiling results.
Install necessary packages
To capture memory usage, we rely on several well-supported, open-source tools. These packages allow us to quickly measure memory consumption and visualize usage over time.
Install the required packages as follows:
pip install torchsummary
pip install memory_profiler
pip install matplotlib
CPU memory profiling
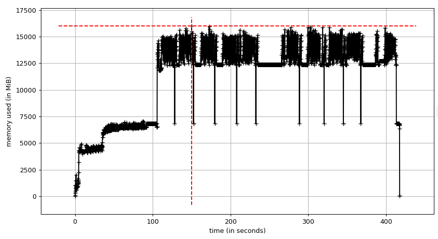
Profiling CPU memory usage is straightforward. By wrapping the Python script with mprof, we can record detailed memory traces during execution.
Example:
mprof run --include-children xxx.py --output mprof_out.dat
mprof plot mprof_out.dat
This generates a memory usage plot similar to the one shown below (example figure not included here). The graph helps identify peak memory usage and potential bottlenecks in the quantization pipeline.
GPU memory profiling(ROCM)
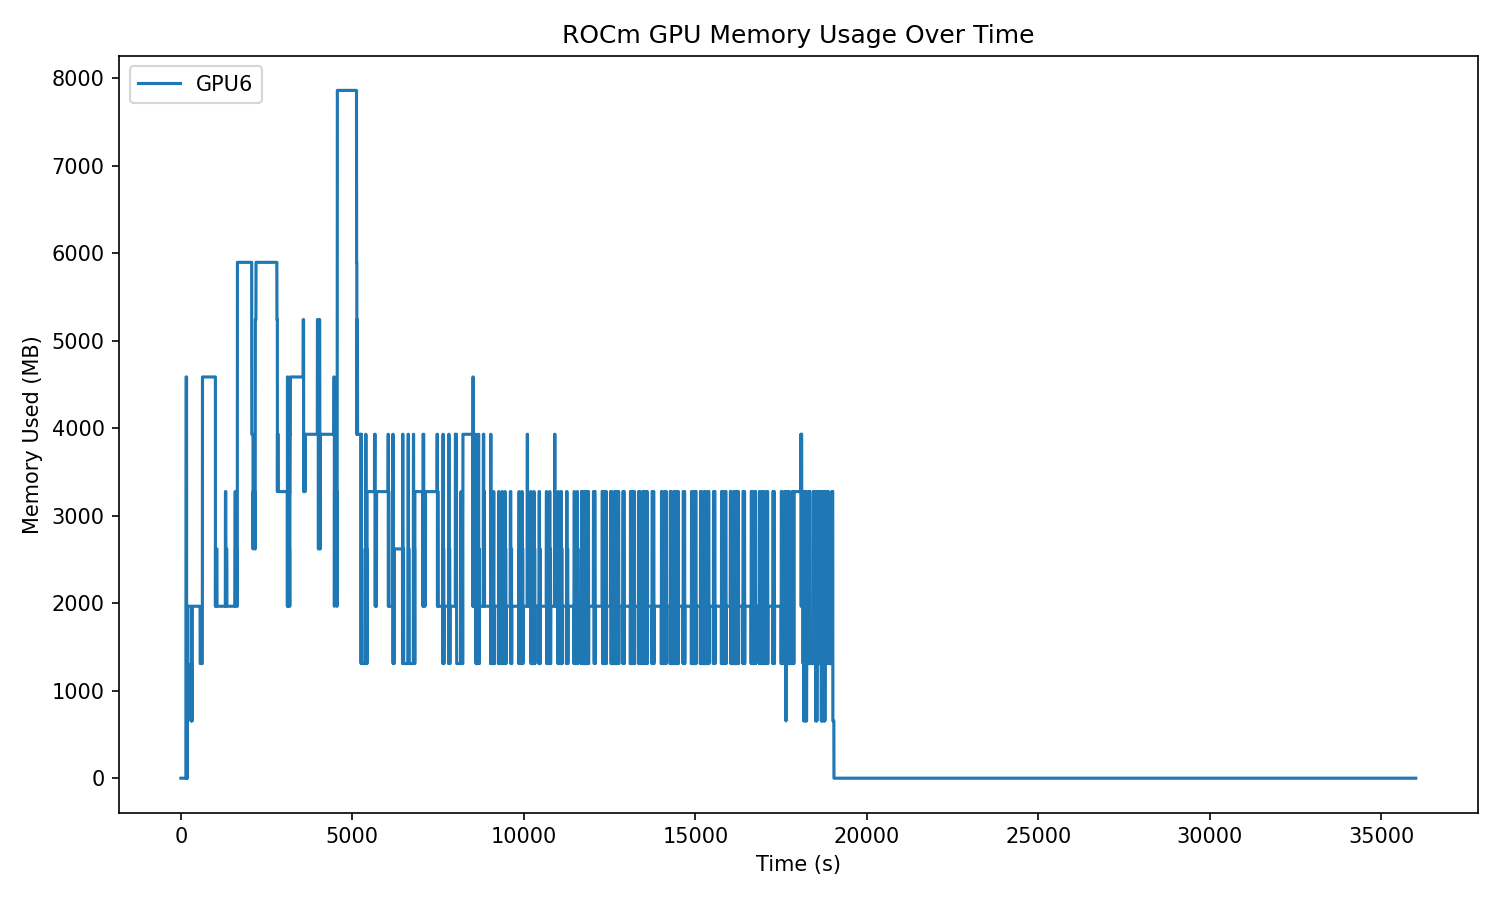
For workflows involving ROCMExecutionProvider or any GPU-based quantization step, Quark ONNX offers a lightweight tool to monitor ROCm GPU memory usage in real time.
Run the following script in parallel with your GPU program:
from quark.onnx.tools.rocm_memory_profiler import monitor_rocm_memory

monitor_rocm_memory(gpu_ids=[6], interval=1, duration=10, save_path="./gpu_memory_usage.png", save_csv=False)
This utility records GPU memory usage at fixed intervals and saves the result as an image (and optionally as a CSV file). The plot clearly shows how memory fluctuates across different quantization stages.
Profiling the Layer with the Largest Estimated Memory Usage
When performing quantization with finetuning, profiling every layer can be time-consuming. To accelerate the process, Quark ONNX allows you to profile only the layer with the highest estimated memory usage.
You can enable this behavior by setting:
from quark.onnx import AdaRoundConfig

SelectMaxMemLayer = True
adaround_algo = AdaQuantConfig(
     learning_rate=0.1,
     fixed_seed=1705472343,
     batch_size=1,
     num_iterations=100,
     output_qdq=True
     mem_opt_level=MemOptLevel,
     select_max_mem_layer=SelectMaxMemLayer
 )
This targeted profiling is especially useful for quickly identifying peak memory requirements in large models or memory-constrained deployment scenarios.