Latency and Memory profiling for Quark ONNX#
Introduction#
AMD Quark ONNX and PyTorch provides comprehensive latency and memory usage profiling through multiple complementary tools:
Built-in GlobalProfiler: Tracks CPU/GPU memory, disk I/O, and timing at major quantization stages (Pre-process, Calibration, Quantization, Post-process). Outputs to
quark_profile.yaml.External Tools: Third-party tools like
mprof(memory_profiler) for additional memory analysis.
This tutorial covers all three approaches, with emphasis on the built-in GlobalProfiler for most use cases.
For general profiler documentation including PyTorch examples and custom metrics, see Built-in Profiling.
Built-in Profiler (Memory and Timing)#
Quark includes a built-in GlobalProfiler that provides comprehensive memory, disk I/O, and timing metrics during ONNX quantization. This profiler tracks CPU memory, GPU memory (CUDA and ROCm), disk read/write activity, and execution timing for each quantization stage.
Automatic Profiling (Zero-Code Setup):
Quark automatically profiles all major quantization stages internally. Simply enable profiling with an environment variable:
  import os
  os.environ["QUARK_PROFILING"] = "1"
  os.environ["CUDA_VISIBLE_DEVICES"] = "0"

  from quark.onnx import quantize_static

  # Profiler auto-starts when QUARK_PROFILING=1
  # Results stream to quark_profile.yaml in real-time

  quantize_static(
      model_input="float_model.onnx",
      model_output="quantized_model.onnx",
      calibration_data_reader=calibration_data_reader,
  )

  # Quark automatically profiles these steps internally:
  # - Pre-process Start/End
  # - Calibration Start/End
  # - Quantization (Static) Start/End
  # - Post-process Start/End
  # No user code changes needed!

Note: User must set CUDA_VISIBLE_DEVICES environment variable for GPU profiling.
Adding User-Defined Checkpoints (Optional):
You can also add application-level profiling for operations outside Quark’s quantization:
import os
os.environ["QUARK_PROFILING"] = "1"

from quark.common.profiler import GlobalProfiler, ProfileStep
from quark.onnx import quantize_static

profiler = GlobalProfiler(output_path="onnx_profile.yaml")

# User-defined: Profile custom data preparation
with profiler.scope(ProfileStep.USER_DEFINED, user_msg="Custom Data Loading"):
    calibration_data = load_and_preprocess_data()
    calibration_data_reader = DataReader(calibration_data)

# Quark auto-profiles internal steps (no manual profiling needed)
quantize_static(
    model_input="float_model.onnx",
    model_output="quantized_model.onnx",
    calibration_data_reader=calibration_data_reader,
)

# User-defined: Profile model validation
with profiler.scope(ProfileStep.USER_DEFINED, user_msg="Model Validation"):
    validate_quantized_model("quantized_model.onnx")
Sample Output (quark_profile.yaml):
memory_usage:
- step: "Start"
  timestamp: 1709395200.0
  relative_time_secs: 0.0
  cpu_memory_mb: 128.5
  gpu_memory_mb: 0.0
  disk_read_mb: 0.0
  disk_write_mb: 0.0
- step: "Pre-process Start"
  timestamp: 1709395201.2
  relative_time_secs: 1.2
  cpu_memory_mb: 256.0
  gpu_memory_mb: 0.0
  disk_read_mb: 45.2
  disk_write_mb: 0.5
- step: "Pre-process End"
  timestamp: 1709395203.5
  relative_time_secs: 3.5
  cpu_memory_mb: 512.5
  gpu_memory_mb: 0.0
  disk_read_mb: 320.8
  disk_write_mb: 1.1
- step: "Calibration Start"
  timestamp: 1709395204.0
  relative_time_secs: 4.0
  cpu_memory_mb: 515.0
  gpu_memory_mb: 1024.0
  disk_read_mb: 325.0
  disk_write_mb: 1.3
- step: "Calibration End"
  timestamp: 1709395220.5
  relative_time_secs: 20.5
  cpu_memory_mb: 520.0
  gpu_memory_mb: 2048.5
  disk_read_mb: 890.4
  disk_write_mb: 2.7
- step: "Quantization (Static) Start"
  timestamp: 1709395221.0
  relative_time_secs: 21.0
  cpu_memory_mb: 768.0
  gpu_memory_mb: 2050.0
  disk_read_mb: 892.1
  disk_write_mb: 3.0
- step: "Quantization (Static) End"
  timestamp: 1709395235.0
  relative_time_secs: 35.0
  cpu_memory_mb: 640.0
  gpu_memory_mb: 1536.0
  disk_read_mb: 905.3
  disk_write_mb: 158.6
- step: "End"
  timestamp: 1709395235.5
  relative_time_secs: 35.5
  cpu_memory_mb: 635.0
  gpu_memory_mb: 1530.0
  disk_read_mb: 906.0
  disk_write_mb: 159.2

# Summary Metrics
total_quantization_time_seconds: 35.5
peak_memory_mb: 768.0
gpu_peak_memory_mb: 2050.0
total_disk_read_mb: 906.0
total_disk_write_mb: 159.2

# Metric Definitions:
#
# Checkpoint Metrics (per record):
# - step: Name of the profiling checkpoint
# - timestamp: Unix timestamp (seconds since epoch)
# - relative_time_secs: Time elapsed since profiling started
# - cpu_memory_mb: Current RSS memory in megabytes
# - gpu_memory_mb: Current GPU memory usage in megabytes
# - disk_read_mb: Cumulative disk bytes read (MB) since the start of profiling
# - disk_write_mb: Cumulative disk bytes written (MB) since the start of profiling
#
# Summary Metrics (overall):
# - total_quantization_time_seconds: Total elapsed time from start to end
# - peak_memory_mb: Peak CPU memory (RSS) during profiling session
# - peak_gpu_memory_mb: Peak GPU memory during profiling session
# - total_disk_read_mb: Total disk bytes read (MB) during the entire profiling session
# - total_disk_write_mb: Total disk bytes written (MB) during the entire profiling session
Available ONNX ProfileStep Constants:
The following ProfileStep constants are automatically used by ONNX quantization functions:
ProfileStep.PRE_PROCESS- Pre-processing operationsProfileStep.CALIBRATION- Calibration stageProfileStep.QUANTIZATION_STATIC- Static quantizationProfileStep.QUANTIZATION_DYNAMIC- Dynamic quantizationProfileStep.QUANTIZATION_MATMUL_NBITS- MatMulNBits quantizationProfileStep.POST_PROCESS- Post-processing operationsProfileStep.FAST_FINETUNE- Fast fine-tuningProfileStep.MODEL_CACHING- Model caching operationsProfileStep.FLOAT_MODEL_VALIDATION- Float model validation
For complete documentation on the built-in profiler, including custom metrics, GPU profiling requirements, and advanced usage, see Built-in Profiling.
External Memory Profiling Tools#
Note: This section describes external memory profiling tools like mprof (memory_profiler).
For built-in memory profiling that’s integrated into Quark, see the “Built-in Profiler” section above.
Efficient memory usage is critical when performing model quantization, especially in environments with limited CPU or GPU resources. This section introduces third-party tools for additional memory profiling beyond Quark’s built-in profiler.
Install necessary packages
To capture memory usage with external tools, you can install the memory_profiler package:
pip install memory_profiler
pip install matplotlib
CPU memory profiling
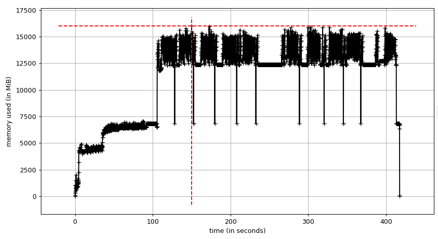
Profiling CPU memory usage is straightforward. By wrapping the Python script with mprof, we can record detailed memory traces during execution.
Example:
mprof run --include-children xxx.py --output mprof_out.dat
mprof plot mprof_out.dat
This generates a memory usage plot similar to the one shown below (example figure not included here). The graph helps identify peak memory usage and potential bottlenecks in the quantization pipeline.
GPU memory profiling
GPU memory profiling is now integrated into Quark’s GlobalProfiler with support for both NVIDIA CUDA and AMD ROCm platforms. The profiler uses:
- nvidia-smi for NVIDIA GPUs
- rocm-smi for AMD ROCm GPUs
See the “Built-in Profiler” section above for usage examples.
Quick Reference:
export CUDA_VISIBLE_DEVICES=0
export QUARK_PROFILING=1
python your_onnx_quantization_script.py
The profiler automatically tracks GPU memory usage and writes results to quark_profile.yaml.
For complete GPU profiling documentation including platform requirements and configuration, see Built-in Profiling.
Legacy External Tool Approach:
For users who prefer external tools, mprof can still track overall process memory consumption, though it does not provide GPU-specific metrics or the granular checkpoint-based tracking of the built-in profiler.
Profiling the Layer with the Largest Estimated Memory Usage
When performing quantization with finetuning, profiling every layer can be time-consuming. To accelerate the process, Quark ONNX allows you to profile only the layer with the highest estimated memory usage.
You can enable this behavior by setting:
from quark.onnx import AdaQuantConfig

SelectMaxMemLayer = True
adaround_algo = AdaQuantConfig(
     learning_rate=0.1,
     fixed_seed=1705472343,
     batch_size=1,
     num_iterations=100,
     output_qdq=True
     mem_opt_level=MemOptLevel,
     select_max_mem_layer=SelectMaxMemLayer
 )
This targeted profiling is especially useful for quickly identifying peak memory requirements in large models or memory-constrained deployment scenarios.
Memory Usage Experiments on Representative Models#
This part reports the peak RSS (Resident Set Size) memory usage observed during quantization of several representative models using AMD Quark for ONNX. Results are presented for four calibration methods: minmax, percentile, layerwise percentile, and minmse.
Memory Usage#
The following table shows the peak RSS memory usage measured. Model size and activation size are provided for reference.
Model |
Model Size |
Activation Size |
minmax |
percentile |
layerwise percentile |
minmse |
|---|---|---|---|---|---|---|
convnext |
109.14 MB |
0.13 G |
2.52 G |
2.66 G |
2.41 G |
2.52 G |
detr |
161.65 MB |
0.87 G |
6.73 G |
8.11 G |
6.05 G |
6.19 G |
esrgan |
64 MB |
8.78 G |
26.4 G |
20.71 G |
21.15 G |
21.63 G |
sam2_image_encoder |
155.18 MB |
5.59 G |
15.58 G |
16.26 G |
16.65 G |
16.71 G |
sam2_image_decoder |
19.61 MB |
0.17 G |
5.69 G |
3.99 G |
4.08 G |
4.12 G |
blip_image_encoder |
328.49 MB |
0.85 G |
5.97 G |
6.68 G |
5.39 G |
6.77 G |
blip_text_decoder |
615.59 MB |
0.11 G |
9.49 G |
9.97 G |
9.46 G |
10.01 G |
resnet50 |
97.8 MB |
0.1 G |
1.8 G |
1.877 G |
1.876 G |
1.879 G |
yolo8 |
12.26 MB |
0.23 G |
0.997 G |
1.066 G |
1.066 G |
1.078 G |
Key Observations#
Activation size is the dominant factor in peak memory usage. Models with large activation tensors (e.g., esrgan at 8.78 G, sam2_image_encoder at 5.59 G) exhibit substantially higher peak RSS regardless of calibration method, while models with small activations (e.g., resnet50 at 0.1 G, yolo8 at 0.23 G) stay under 2 G across all methods.
Calibration methods have a relatively modest effect on peak memory. For most models the four methods produce results within 1–2 G of each other. The choice of calibration method is therefore driven primarily by accuracy requirements rather than memory constraints.
Minmax tends to yield the lowest or near-lowest peak memory for activation-heavy models (e.g., sam2_image_encoder: 15.58 G vs. 16.26–16.71 G for other methods), likely because it avoids the additional data structures required by percentile-based or MSE-based calibration.
Small models are memory-efficient across the board. Resnet50 and yolo8 both consume under 2 G peak RSS with every calibration method, indicating that the quantization pipeline introduces minimal overhead for models with modest parameter counts and activation footprints.